

Databricks is powerful. But when your monthly bill starts growing and you need to understand exactly where the money goes, the native tooling can feel like a starting point rather than a solution. This article explains what we built with Lakesight, and why.
Serverless is great — but classic clusters aren't going anywhere
Databricks serverless compute is a fantastic option for many use cases: exploring a catalog, running lightweight notebooks, powering dashboards, executing small but frequent jobs. It abstracts away infrastructure entirely, and for these workloads, that’s exactly what is needed.
But when it comes to heavy, recurring data transformation pipelines — the ETL and ELT batch workloads that run every day, process large amounts of data and form the backbone of your data platform — classic compute clusters remain the go-to choice for most teams. The reasons are practical:
- Cost control: You choose instance types, set autoscaling bounds, and can evaluate the cost impact of every configuration change.
- Predictability: The cluster configuration doesn’t change nor the workload, costs are predictable.
- Optimization levers: Node types, pool sizing, autoscaling parameters, spot/on-demand instances — there’s a lot to tune.
When your Databricks bill is $10k, $30k, or $50k+ per month, the ability to understand where that money goes — down to every job run and cluster — is what makes cost optimization possible.
Databricks has been investing in this area. System tables like system.billing.usage give you raw DBU consumption data. The Account Console offers usage dashboards and budget policies. These are solid building blocks.
But after spending months working with Databricks cost data on real production environments, we kept running into the same friction points. So we built Lakesight to address them.
What Lakesight brings
Lakesight is a multi-workspace cloud agnostic cost calculation tool for Databricks. It calculates Databricks costs at run granularity based on clusters events available through rest-API. See Costs calculation for more details on how Lakesight calculates costs.
For each run, both the Databricks part (DBU costs), as well as the underlying instances part (cloud provider virtual machines costs) are calculated and displayed together in charts to allow easy cost analysis.
In the following sections are described some of its features.
Analyze a Job — understand the real cost of configuration changes
This is the feature we’re most excited about because it directly enables cost optimization decisions.
Lakesight's Analyze a Job feature lets you select any job and instantly see:
- Cost and duration trends over time: with each run color-coded by the node type that was used
- Task-level cost breakdown: for multi-task jobs
- KPI summary: total cost, average cost per run, average duration, total runs, last run
This feature is particularly useful to evaluate the impact on both cost and duration of a job when changing the cluster parameterization that runs it and allows at a glance to evaluate a better configuration.
Real example: below is a screenshot of Analyze a job page from Lakesight showing the cost evolution of a heavy workload. The first bar chart shows cost evolution per execution, with VM cost in dark, and DBU cost in red. The second bar chart shows the associated execution time.
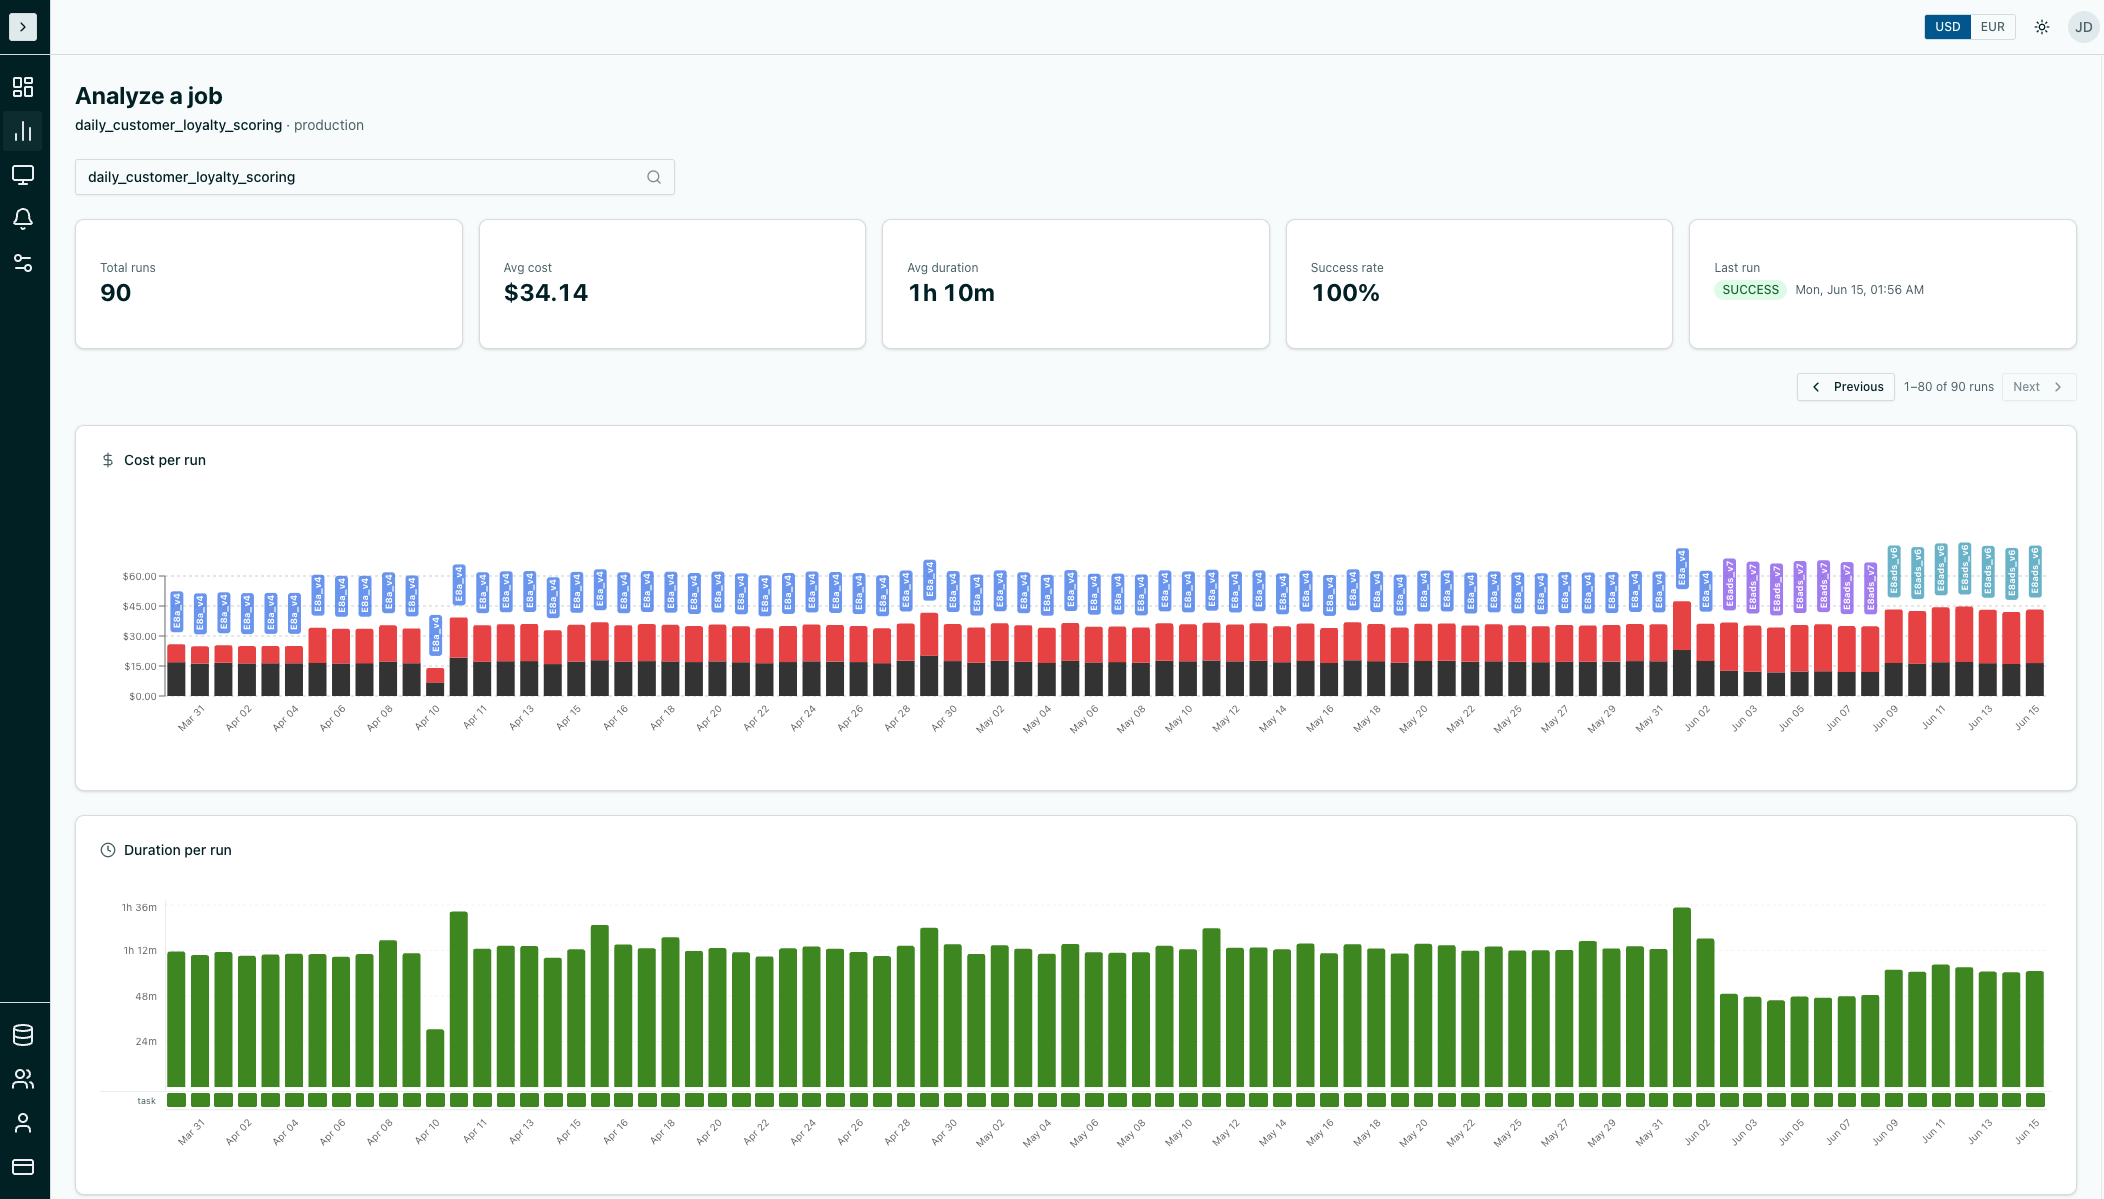
Lakesight — Analyze a job by monitoring its total cost and duration over time
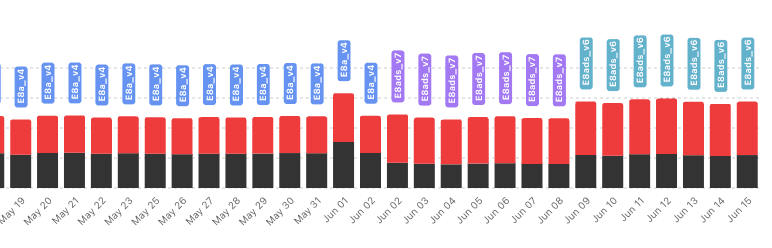
As you can clearly see, the node type was changed on June 2nd, then changed again on June 9th. Below are the costs of each of them (as of June 2026).
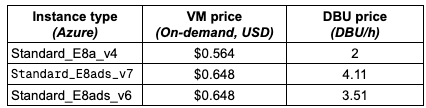
Azure instances and associated costs (Jun. 2026)
What node type could we say is the best by just having a look at the barcharts? Obviously, the purple one Standard_E8ads_v7: even if not cheaper overall than Standard_E8a_v4 (about as expensive), it runs almost 30min faster.
What is important to note here, is that the DBU cost part is much higher for Standard_E8ads_v7 than for Standard_E8a_v4. And indeed, by only looking at the DBU cost in the chart we clearly see that it has increased.
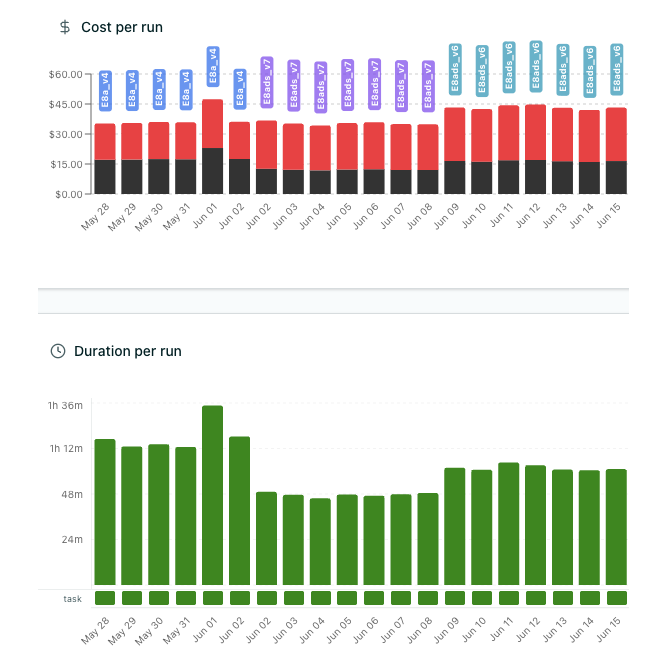
Lakesight — analyze a job — node type optimization
Thus, by only comparing DBU costs (what Databricks shows natively in its billing tables), we could think Standard_E8ads_v7 is not a good choice.
However, the job runs significantly faster with Standard_E8ads_v7, and this has a huge impact on VM costs which are drastically lower with the new instance.
This example also shows immediately, at a glance, that Standard_E8ads_v6 is clearly inferior compared to the Standard_E8ads_v7 version. A switch from Standard_E8ads_v6 to Standard_E8ads_v7 would be a quick win helping save 12 minutes of execution time and near 20% in costs.
Full cost visibility — VM and DBU costs combined
Databricks system tables report DBU consumption. The cloud provider reports VM infrastructure costs. But the total cost of a job run — what it actually costs to execute — is the sum of both.
As illustrated in the example in the previous section, Lakesight computes both components automatically: VM costs from public cloud pricing (Azure, AWS, GCP) and DBU costs from Databricks list prices, accounting for workspace tier and Photon multipliers. Every job, every run, every cluster has a complete cost picture.
This makes relative comparisons meaningful. When you see that Job A costs $12.40 per run and Job B costs $3.80, that’s the full cost — not just the DBU portion.
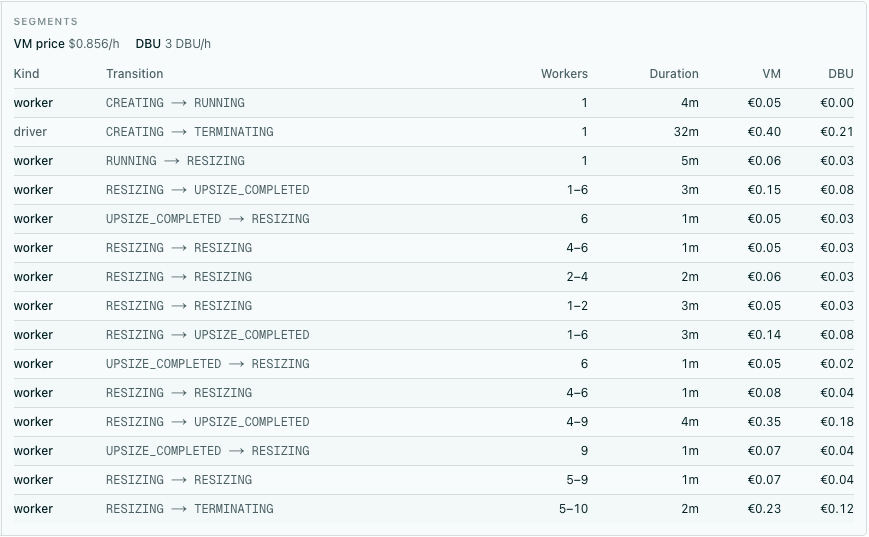
Lakesight — Job Costs breakdown by node type
Cost breakdowns by job, tag, node type, and date
Lakesight breaks down costs across multiple dimensions — and all of them include the full cost (VM + DBU):
- By job: rank workloads by total cost and immediately see where to focus optimization efforts
- By custom tag: if your Databricks clusters or jobs use custom tags (team, project, environment, cost center), Lakesight automatically discovers them and lets you group and filter costs by any tag key and value. This is particularly useful for chargeback reporting or understanding spend by business unit.
- By node type: which instance types are driving the most spend across all your jobs?
- By date: daily cost trends with drill-down into individual runs
The dashboard also surfaces your top workloads across all registered workspaces, ranked by cost. One click takes you from a high-cost job to its detailed cost breakdown, and from there into the Analyze a Job view for optimization.
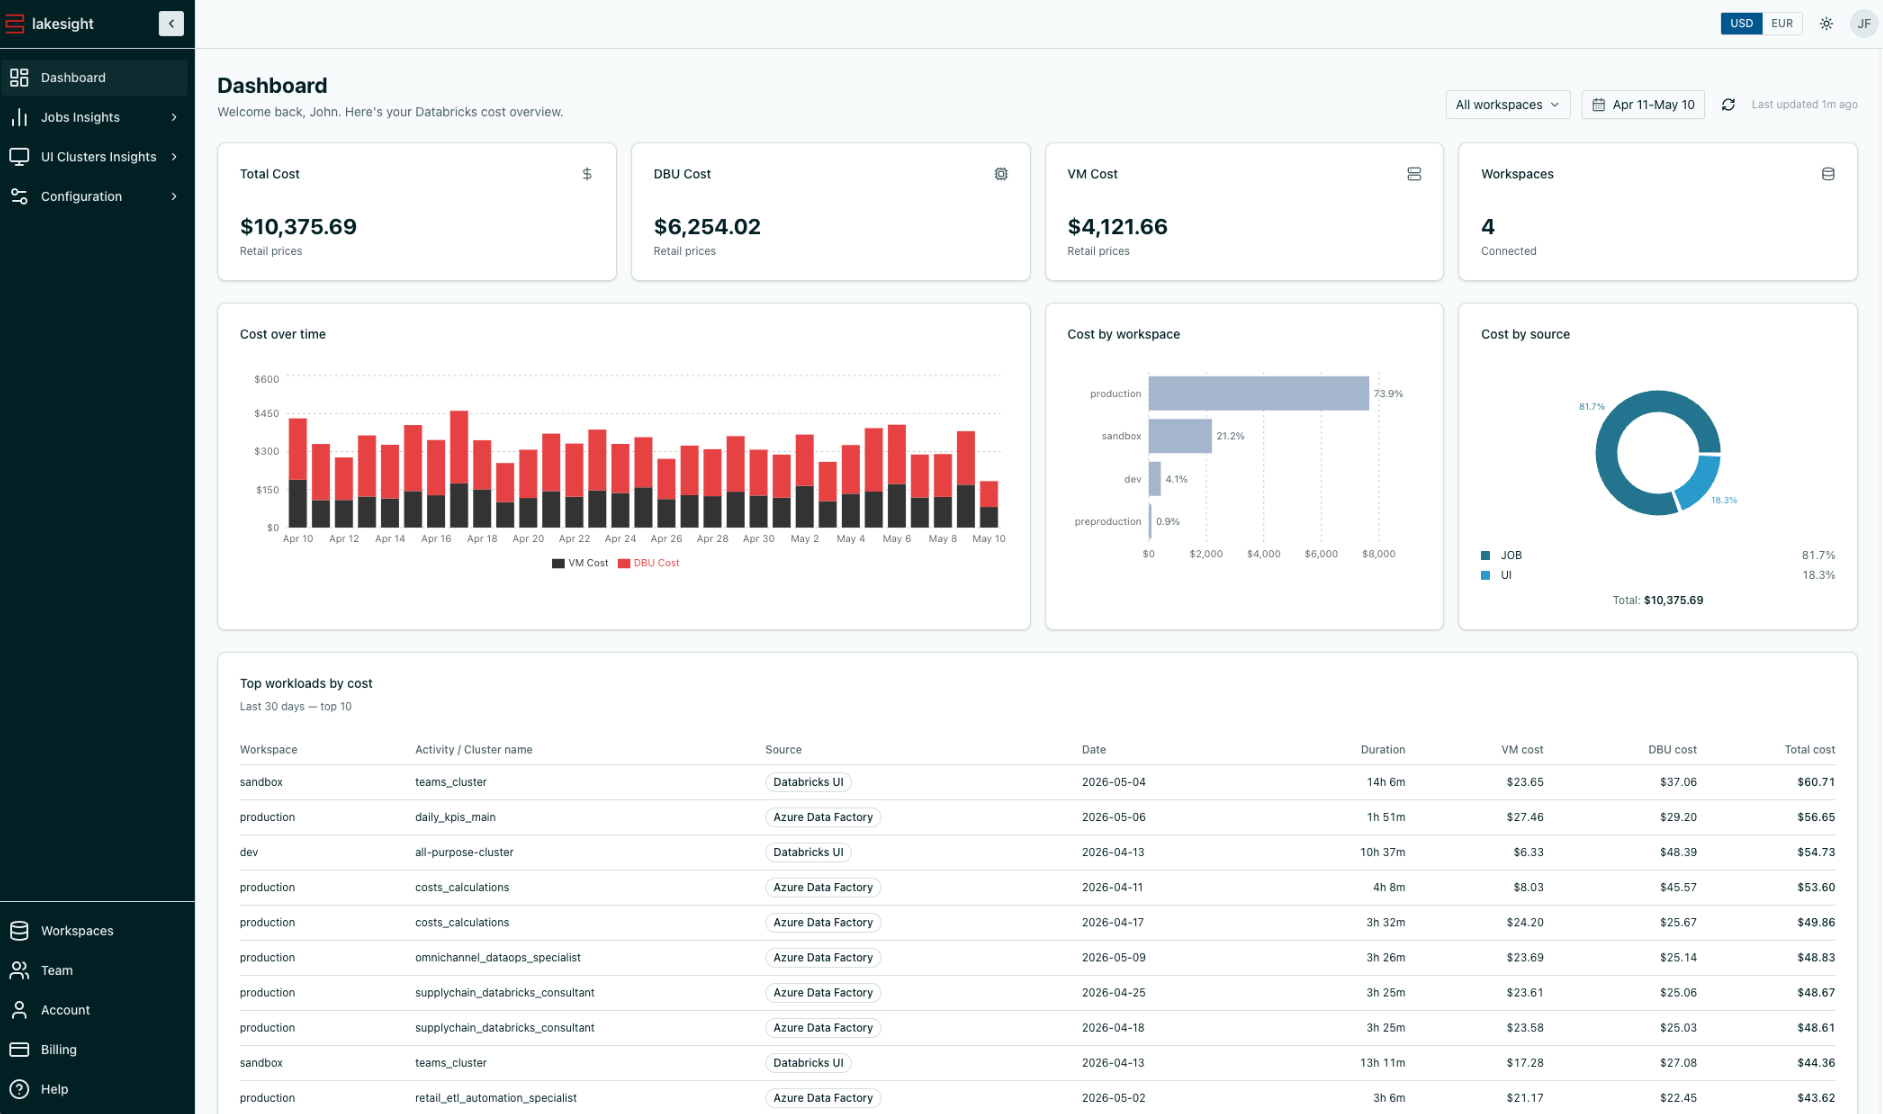
Lakesight — screenshot of the main dashboard
Interactive cluster costs and configuration audit
Interactive clusters — the all-purpose clusters that data scientists and analysts use from the Databricks workspace for daily exploration and ad-hoc analyses — can be surprisingly expensive. In large organizations, they can quietly account for a significant portion of the total bill.
Lakesight tracks interactive clusters across all workspaces: which ones are running, who launched them, how long they've been active, and what they cost — again, showing full VM + DBU cost.
Beyond cost tracking, the UI Clusters configuration page gives you a consolidated view of every interactive cluster's settings across all registered workspaces. This makes it straightforward to spot things like auto-termination set to 2 hours instead of 20 minutes, oversized instance types for simple exploration work, or clusters left running over weekends.
Instance pool usage and job mapping
For organizations using instance pools, understanding which jobs use which pools — and how well those pools are utilized — is important for right-sizing decisions.
Lakesight shows all instance pools across registered workspaces, with a direct mapping to the jobs that use them. This visibility helps teams decide whether to consolidate pools, resize them, or reassign jobs to different pools for better utilization.
Alerting — including for submitted and externally orchestrated jobs
Lakesight includes built-in alerting with three types:
- Job run failure alerts: email notification when any job fails
- Abnormal duration alerts: detect when a job runs significantly longer than its historical baseline
- Long-running UI cluster alerts: flag interactive clusters that have been active beyond a configurable threshold
Setting up an alert takes a few clicks — select the type, pick the scope, done.
One thing worth highlighting: Lakesight's alerting covers every job visible through the Databricks API, regardless of how it was launched. This includes runs submitted by external orchestrators like Azure Data Factory, Apache Airflow, Dagster, Prefect, AWS Step Functions, or Google Cloud Composer. For teams where the majority of production workloads are orchestrated externally, this fills an important gap.
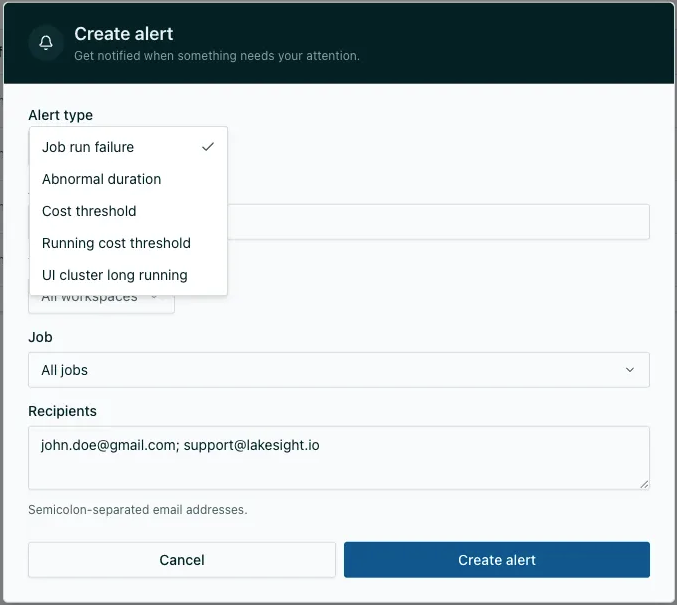
Lakesight — Create alerts on any job, including submitted jobs
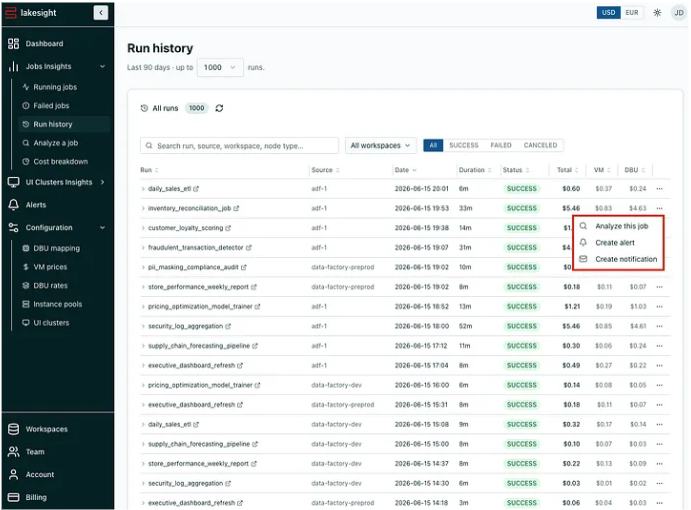
Lakesight — Create an alert or a notification in a few clicks from any page
Scheduled cost reports
Daily, weekly, or monthly cost reports delivered by email. Reports can be broken down by job or by custom tag, on a fully configurable schedule with any number of recipients. Useful for engineering managers or finance teams who need regular cost summaries without logging into a dashboard.
Near real-time monitoring
Lakesight ingests data every few minutes, providing a near real-time view of what's consuming resources right now. You can see running jobs and active UI clusters, catch runaway workloads before costs accumulate, and track the state of your cluster fleet across workspaces — all from a single page.
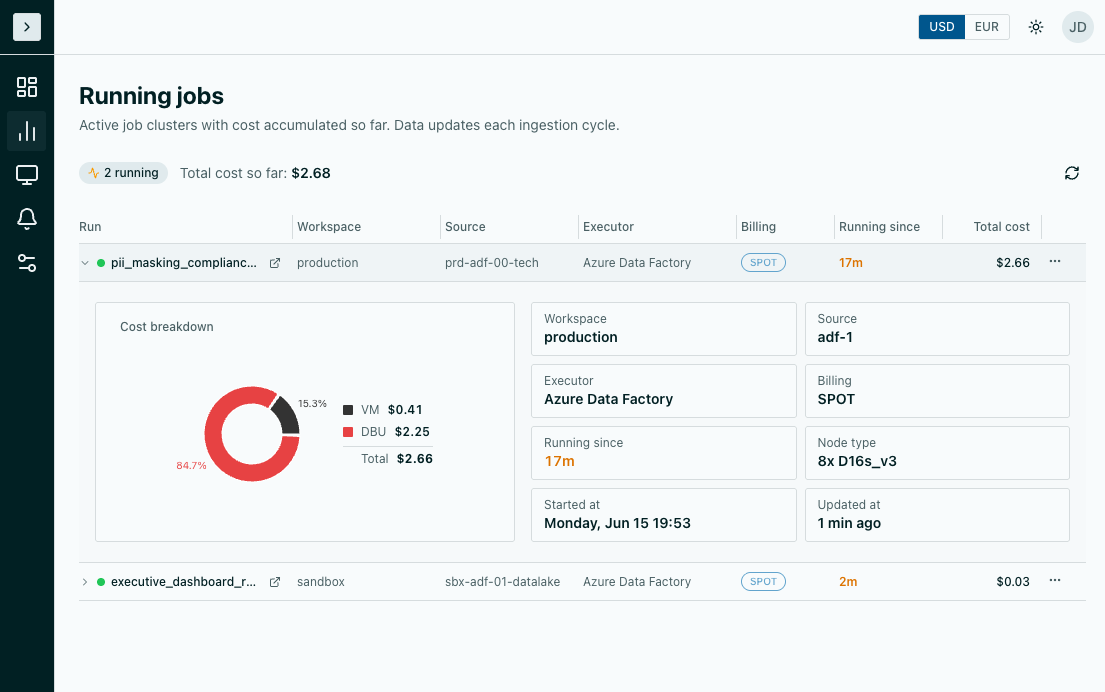
Lakesight - near realtime job cost tracking
Multi-workspace, multi-cloud
Many organizations run multiple Databricks workspaces — by environment, by team, by cloud provider, or by region. Lakesight brings them all into a single dashboard.
Workspaces on Azure, AWS, and GCP are all supported. Cloud-specific VM pricing and DBU rates are handled automatically. You register a workspace, and Lakesight takes care of the rest — no need to worry about which pricing API to call or which DBU rate table applies.
Setup — genuinely under 5 minutes
We designed Lakesight to be plug-and-play, and we mean it literally:
- Sign up at app.lakesight.io
- Register a workspace — provide the Databricks workspace URL and either a Personal Access Token (PAT) or OAuth M2M service principal credentials
- Done. Lakesight starts ingesting data immediately. First cost breakdowns appear within minutes.
No cloud provider permissions needed. No Azure subscription access, no AWS IAM roles, no GCP service accounts. Lakesight connects directly to the Databricks REST API with read-only access to the clusters and jobs scopes. Optionally, you can grant instance-pools and libraries for additional visibility.
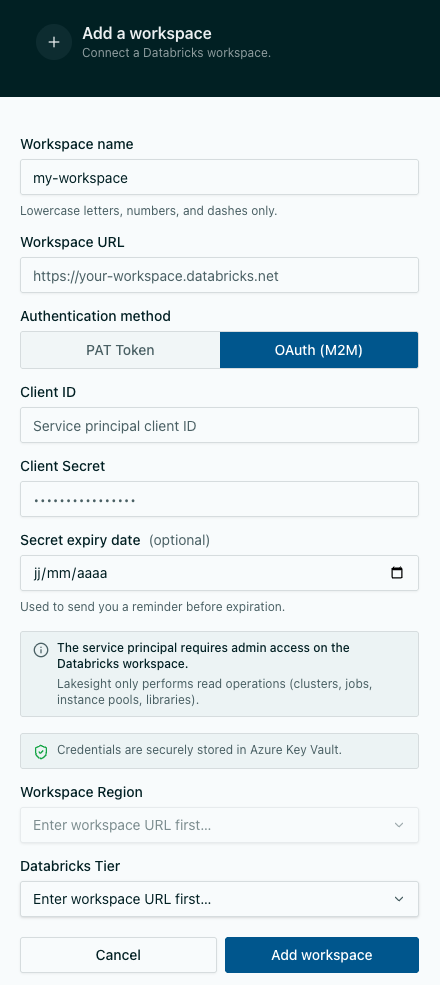
Lakesight — workspace registration can be either using a PAT token or a service principal
A note on limitations
We believe in being upfront about what Lakesight does and doesn't cover:
- Serverless compute is not tracked. Lakesight focuses on cluster-based workloads — the ones where configuration decisions directly impact cost and where there's an optimization surface to work with.
- Costs are estimates based on public list prices. If your organization has negotiated rates, enterprise agreements, reserved instances, or committed-use discounts, actual costs will differ from what Lakesight computes. The tool's value is in relative comparisons — which job costs more, did the cost go up or down after a configuration change — rather than matching the invoice to the cent.
- SQL warehouses are not currently tracked.
These are deliberate trade-offs. Lakesight is focused on classic compute cost visibility and optimization — the workloads where teams have the most levers to pull.
Why not build it in-house?
This is a fair question. Databricks system tables provide raw data. Many teams have data engineers who could build dashboards. Why use an external tool?
Having built Lakesight ourselves, we can say from experience: the initial dashboard is the easy part. The ongoing maintenance is where it gets expensive:
- System tables and APIs evolve — queries break, schemas change
- Adding alerting means building and maintaining a notification pipeline
- A second workspace means rethinking the data model
- Custom tags require auto-discovery logic and UI changes
- VM pricing across three cloud providers needs regular updates
- The person who built it moves teams
Lakesight handles all of this as managed infrastructure. Your team stays focused on building data pipelines and delivering value — not maintaining internal cost tooling.
Try it
You can create an account and explore Lakesight at lakesight.io — setup takes under 5 minutes, and you'll have cost breakdowns within minutes of registering your first workspace.
Lakesight supports Databricks workspaces on Azure, AWS, and GCP. Questions? Reach out at support@lakesight.io.